For researchers with data and a question

You have data and a question. Between them sits the statistics.

Upload a spreadsheet. Choose the columns you want to understand. Coquali shows the relationship, the statistics behind it, and what they mean. One place, every change undoable.

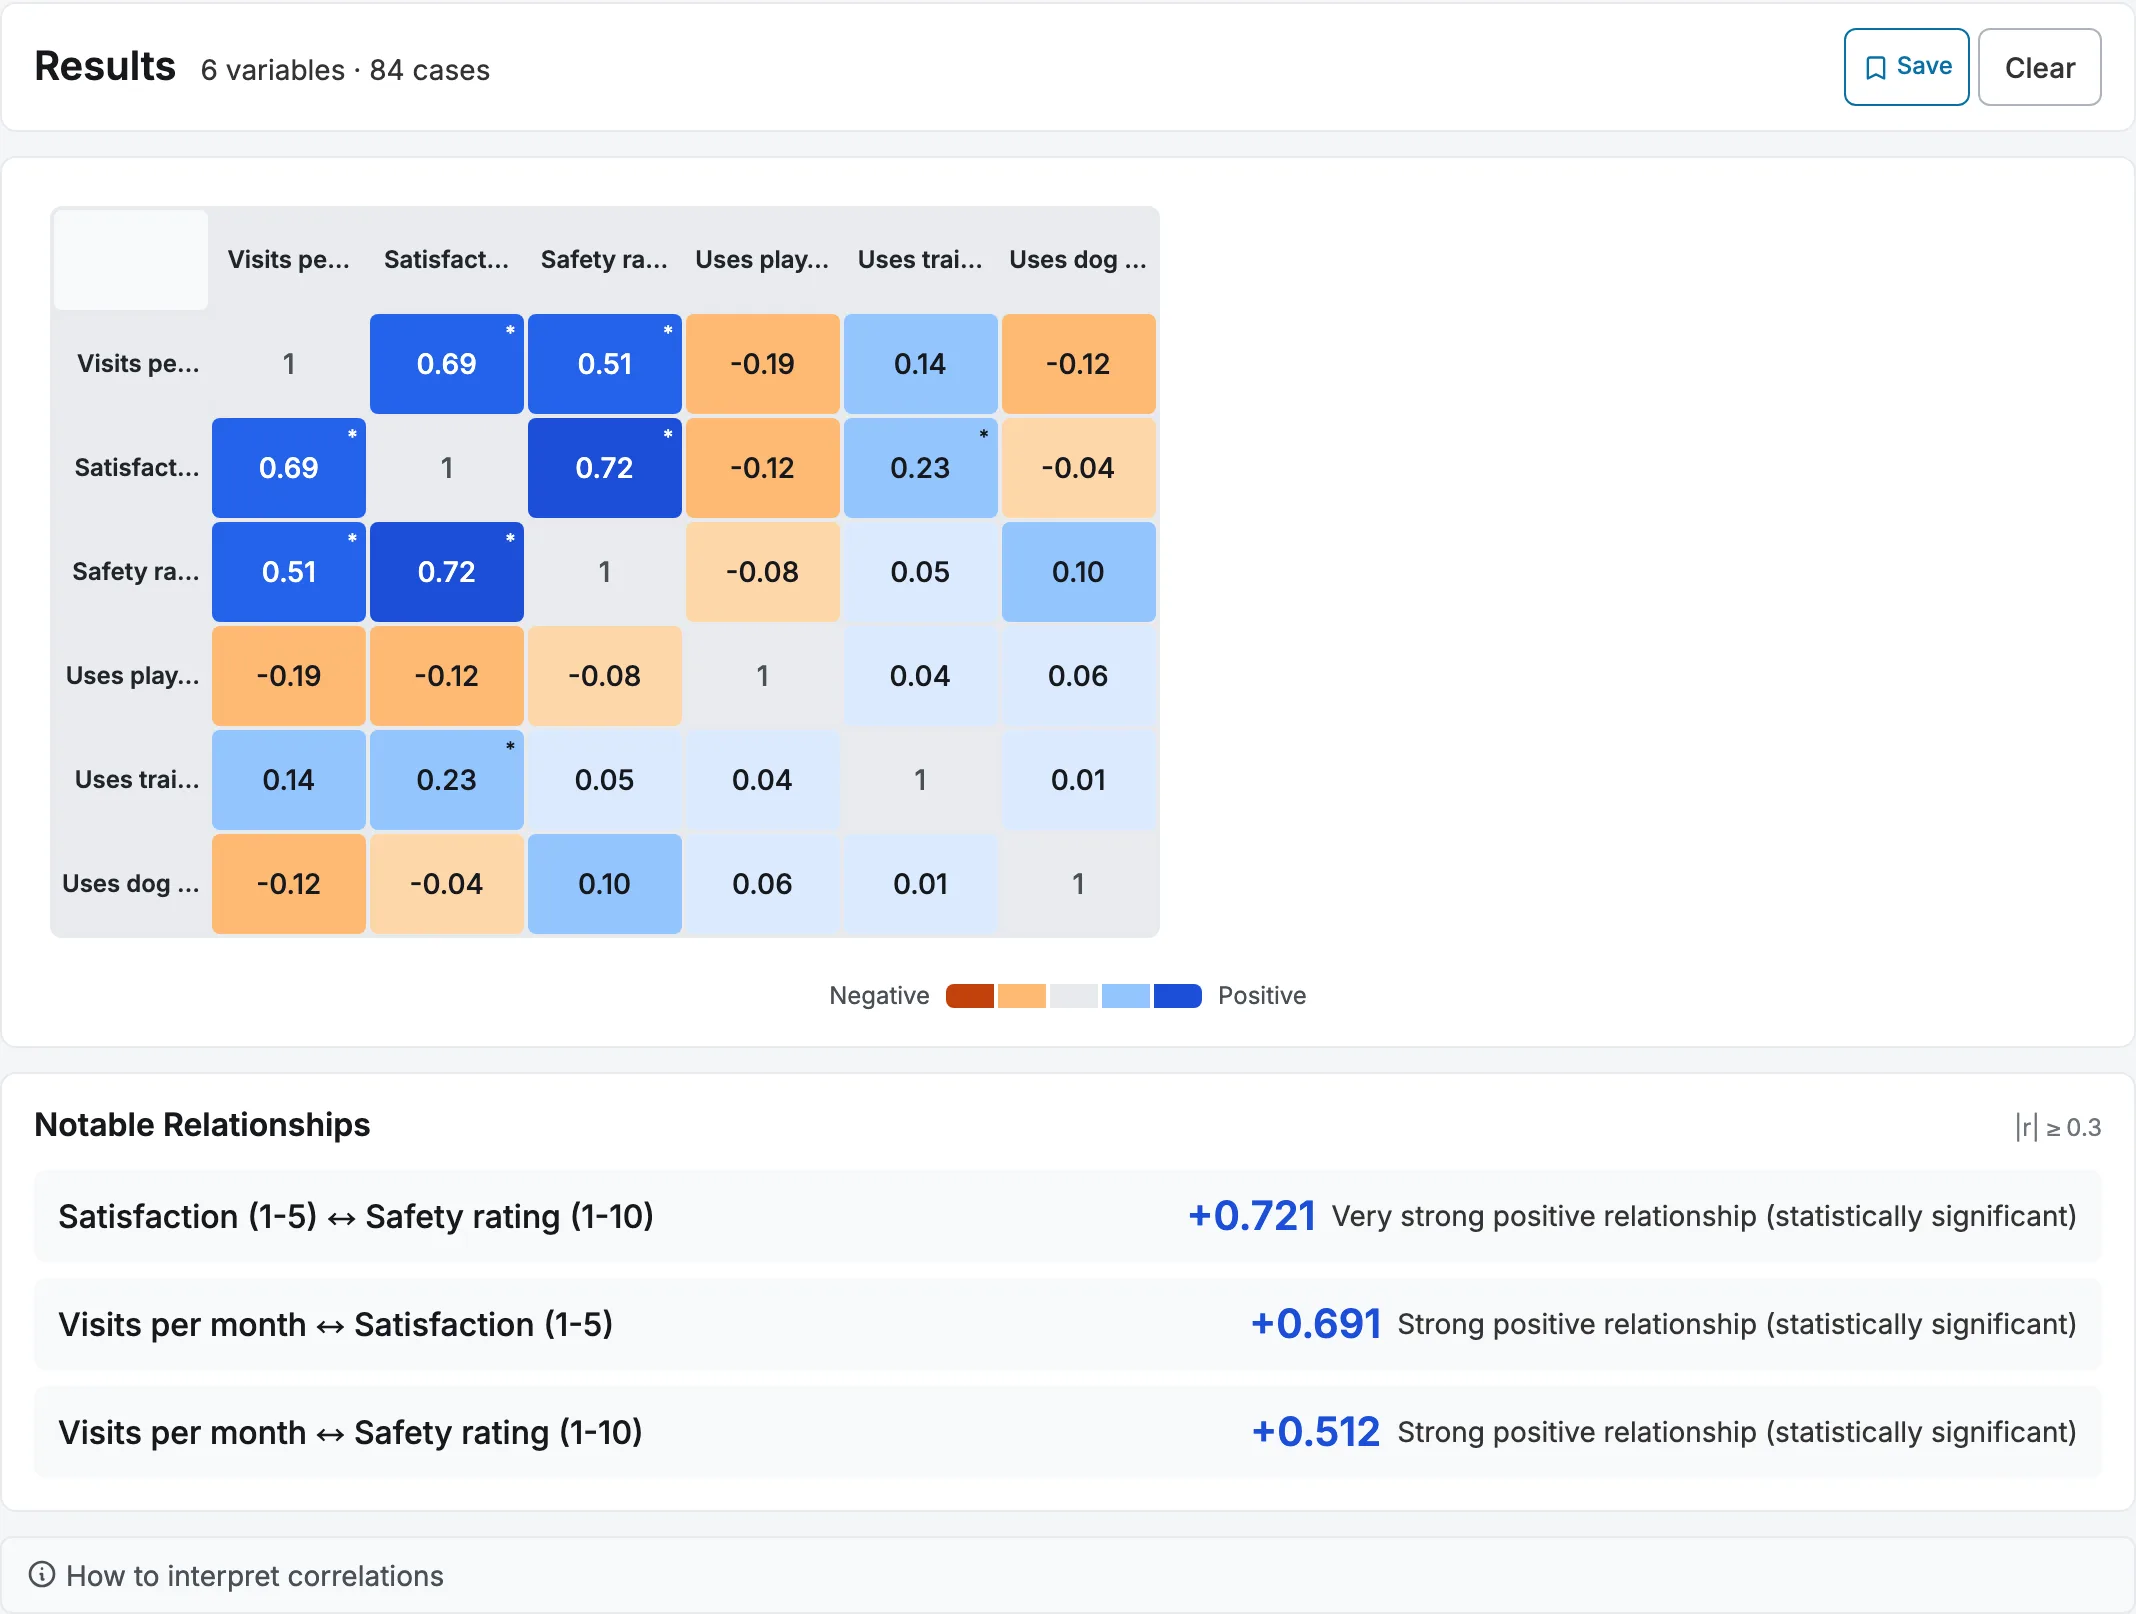
Coquali correlation page showing a heatmap of survey variables with strength and significance labels.

The problem

The gap between having data and understanding it

Most research analysis runs across five or six tools. Data in Excel. Notes in Word. Statistics in SPSS or R, when you can face them. Code from ChatGPT, then the error pasted back, then a different error. A folder of files named data_v2_final_FINAL.xlsx. The pipeline takes more of the week than the thinking you actually care about.

“I do not have the capacity to figure it out myself, just to copy and paste it again to GPT.”

PhD student, sociology

How it works

Upload. Click. See. Understand.

01

Bring the spreadsheet you already have.

CSV, Excel or JSON. Coquali reads the file, sorts each column into numeric, categorical or text, and shows you an example value from every one before you do anything else. Rename a column or change how it charts from the same page.
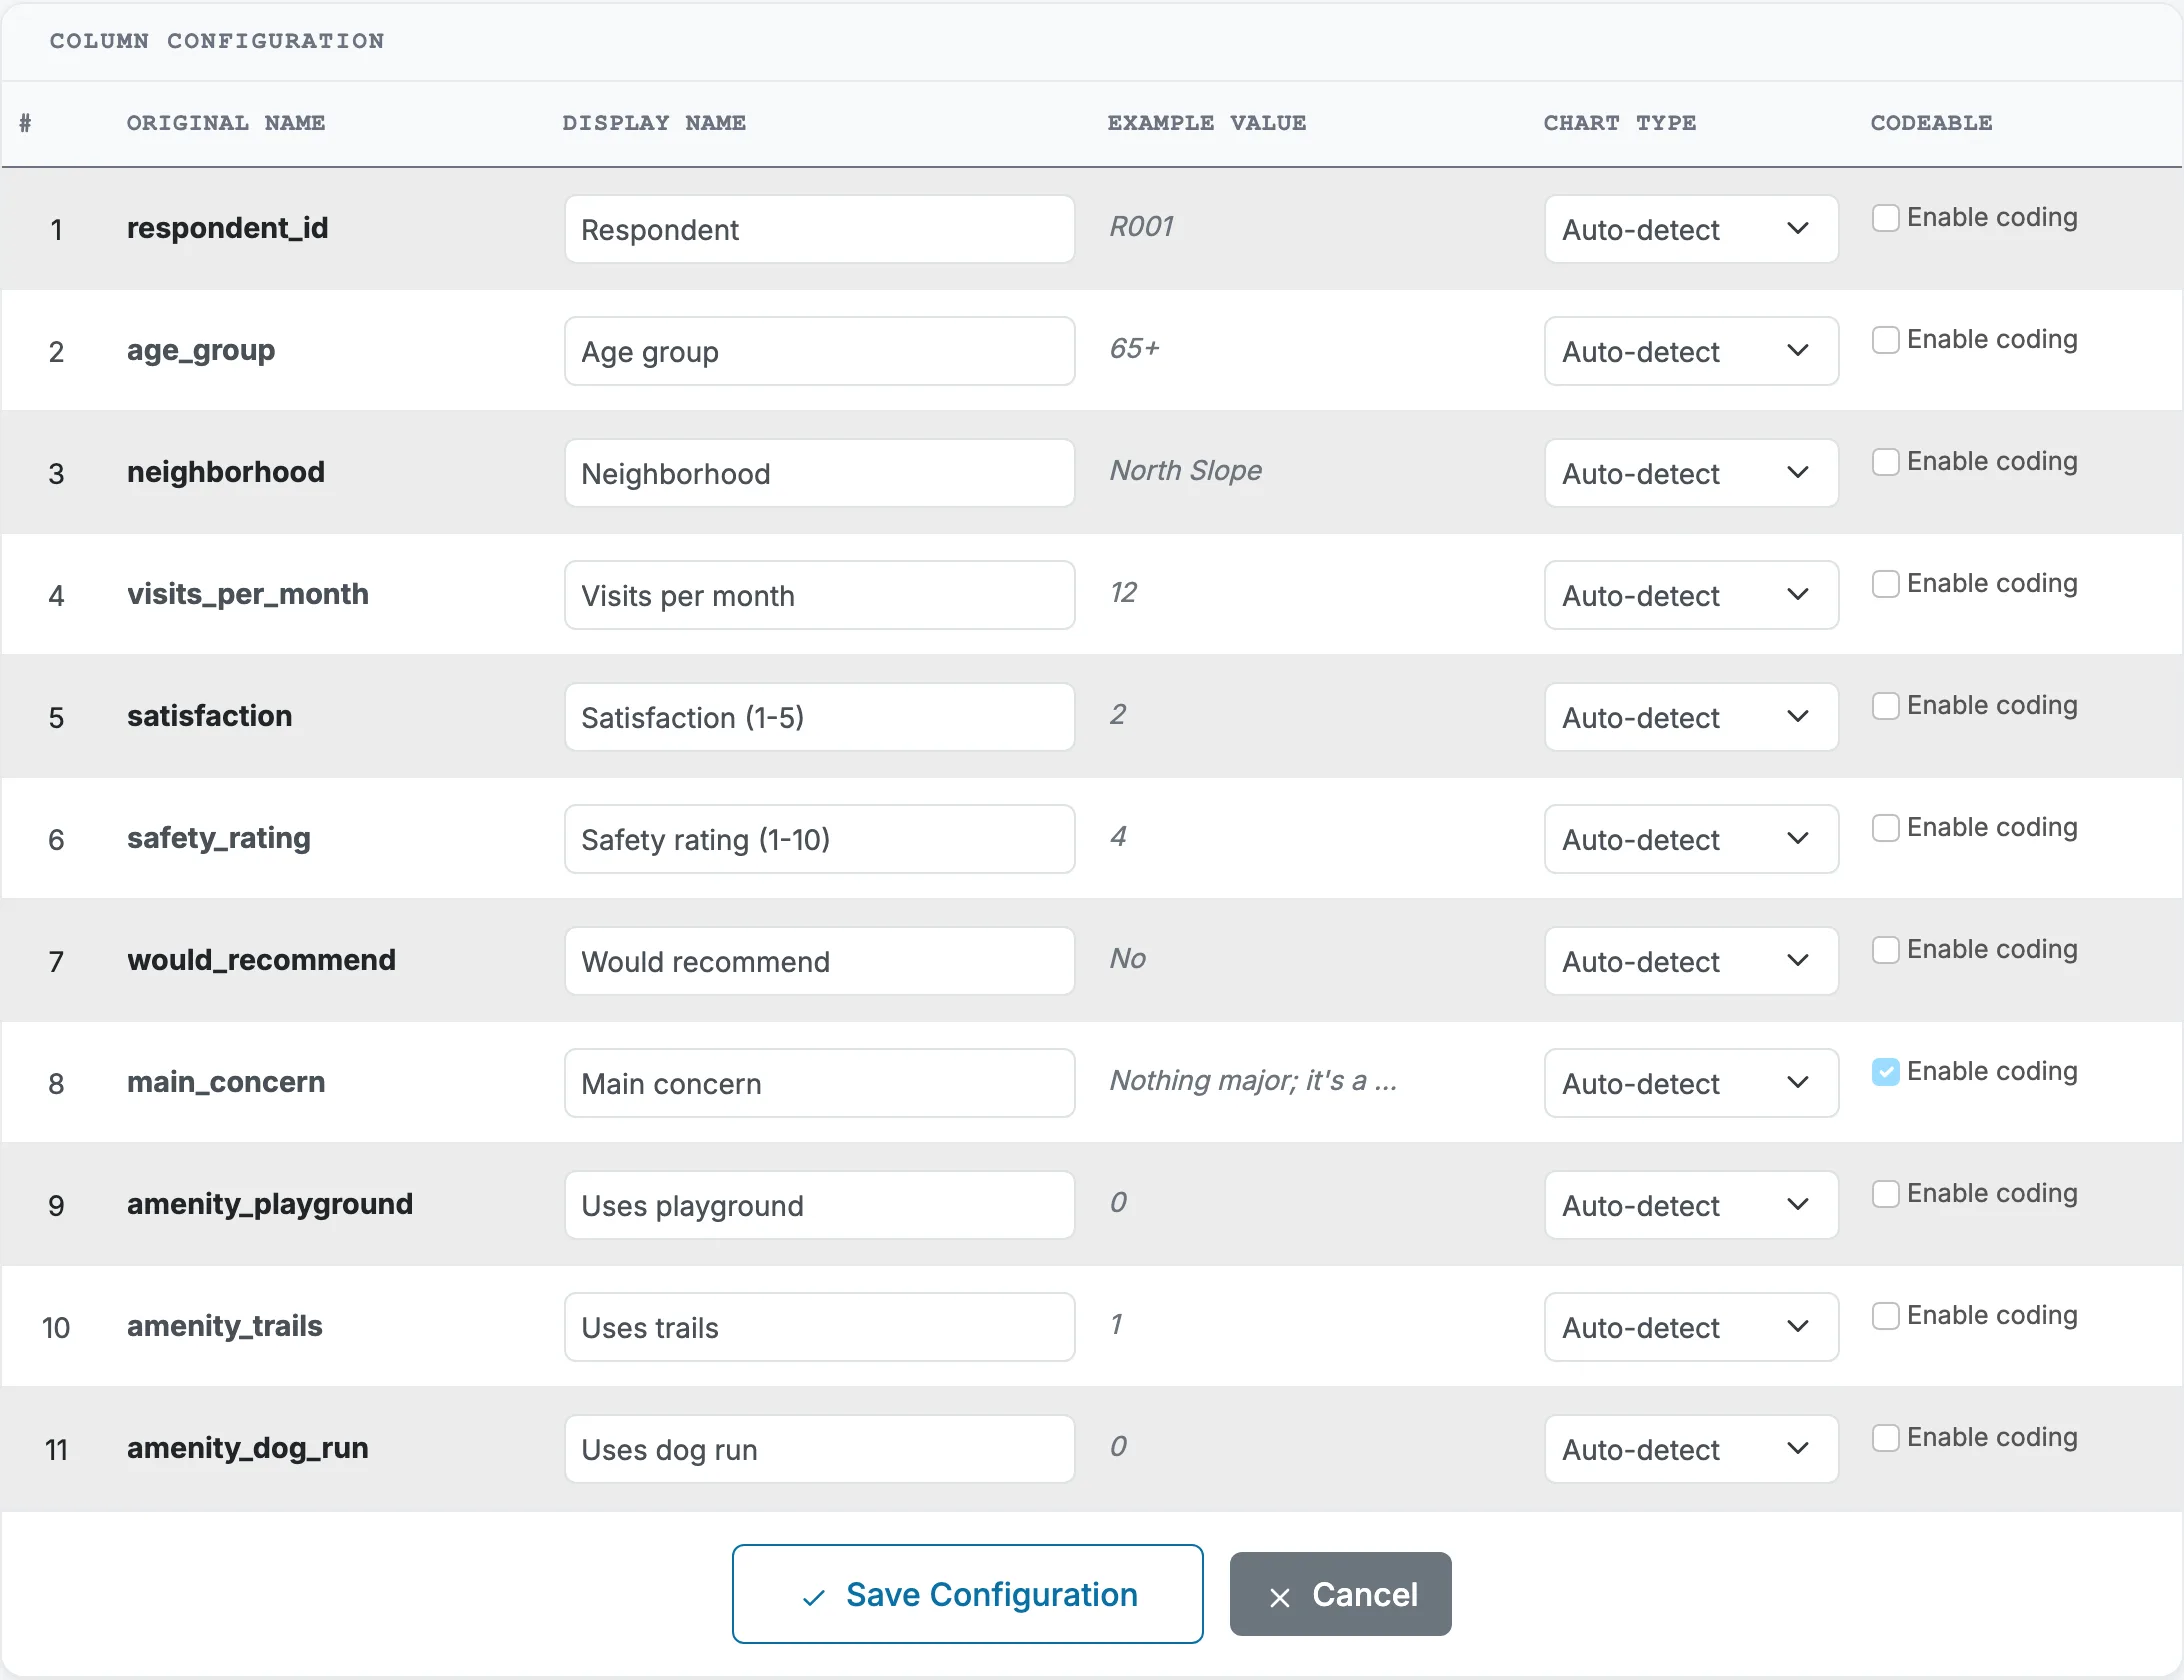
Column settings page listing each survey column with its display name, an example value and its chart type.
02

Choose what you want to understand.

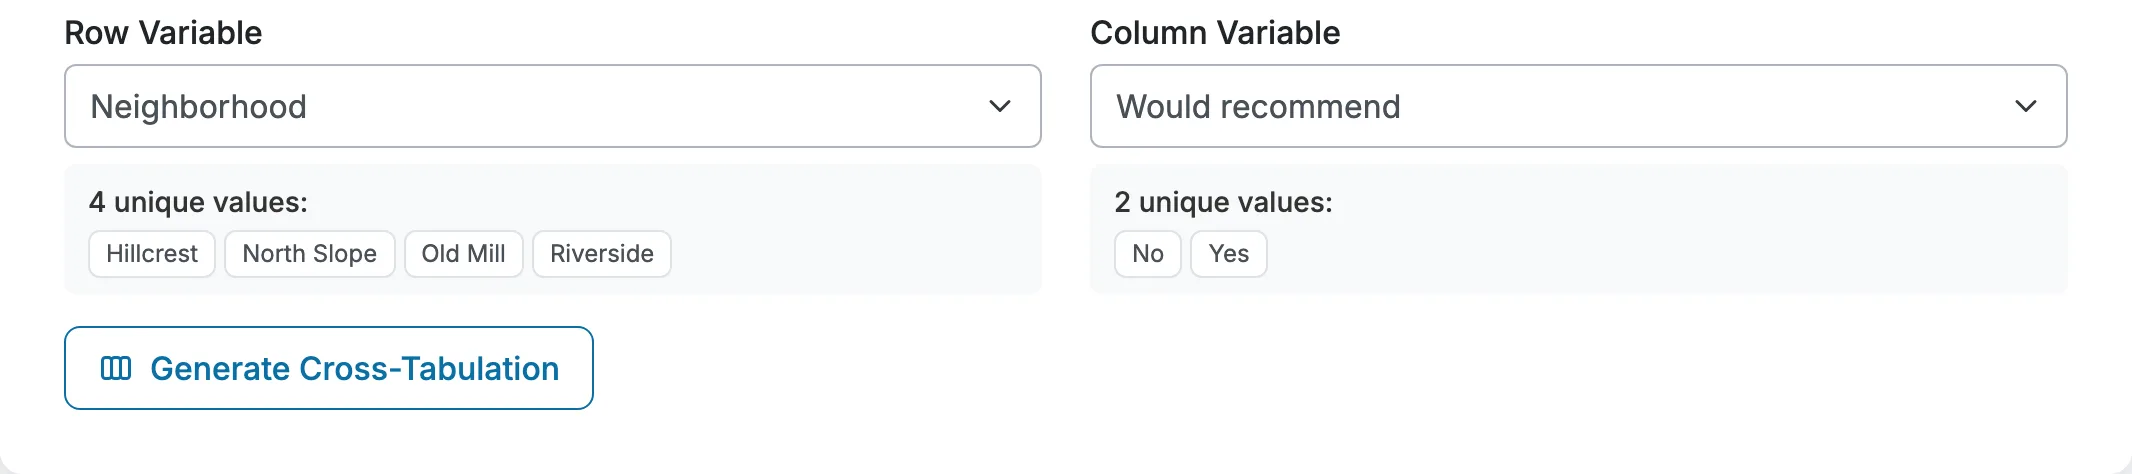
Pick the columns you have a question about and the analysis that fits them: a cross-tabulation for two categories, a correlation for two numbers, a logistic regression for a yes/no outcome.

“Oh my gosh, wait, there's a correlate button. Oh, I love that.”

Thesis student, first session
Cross-tabulation setup with Neighborhood and Would recommend selected as the two variables.
03

Look at it before you trust it.

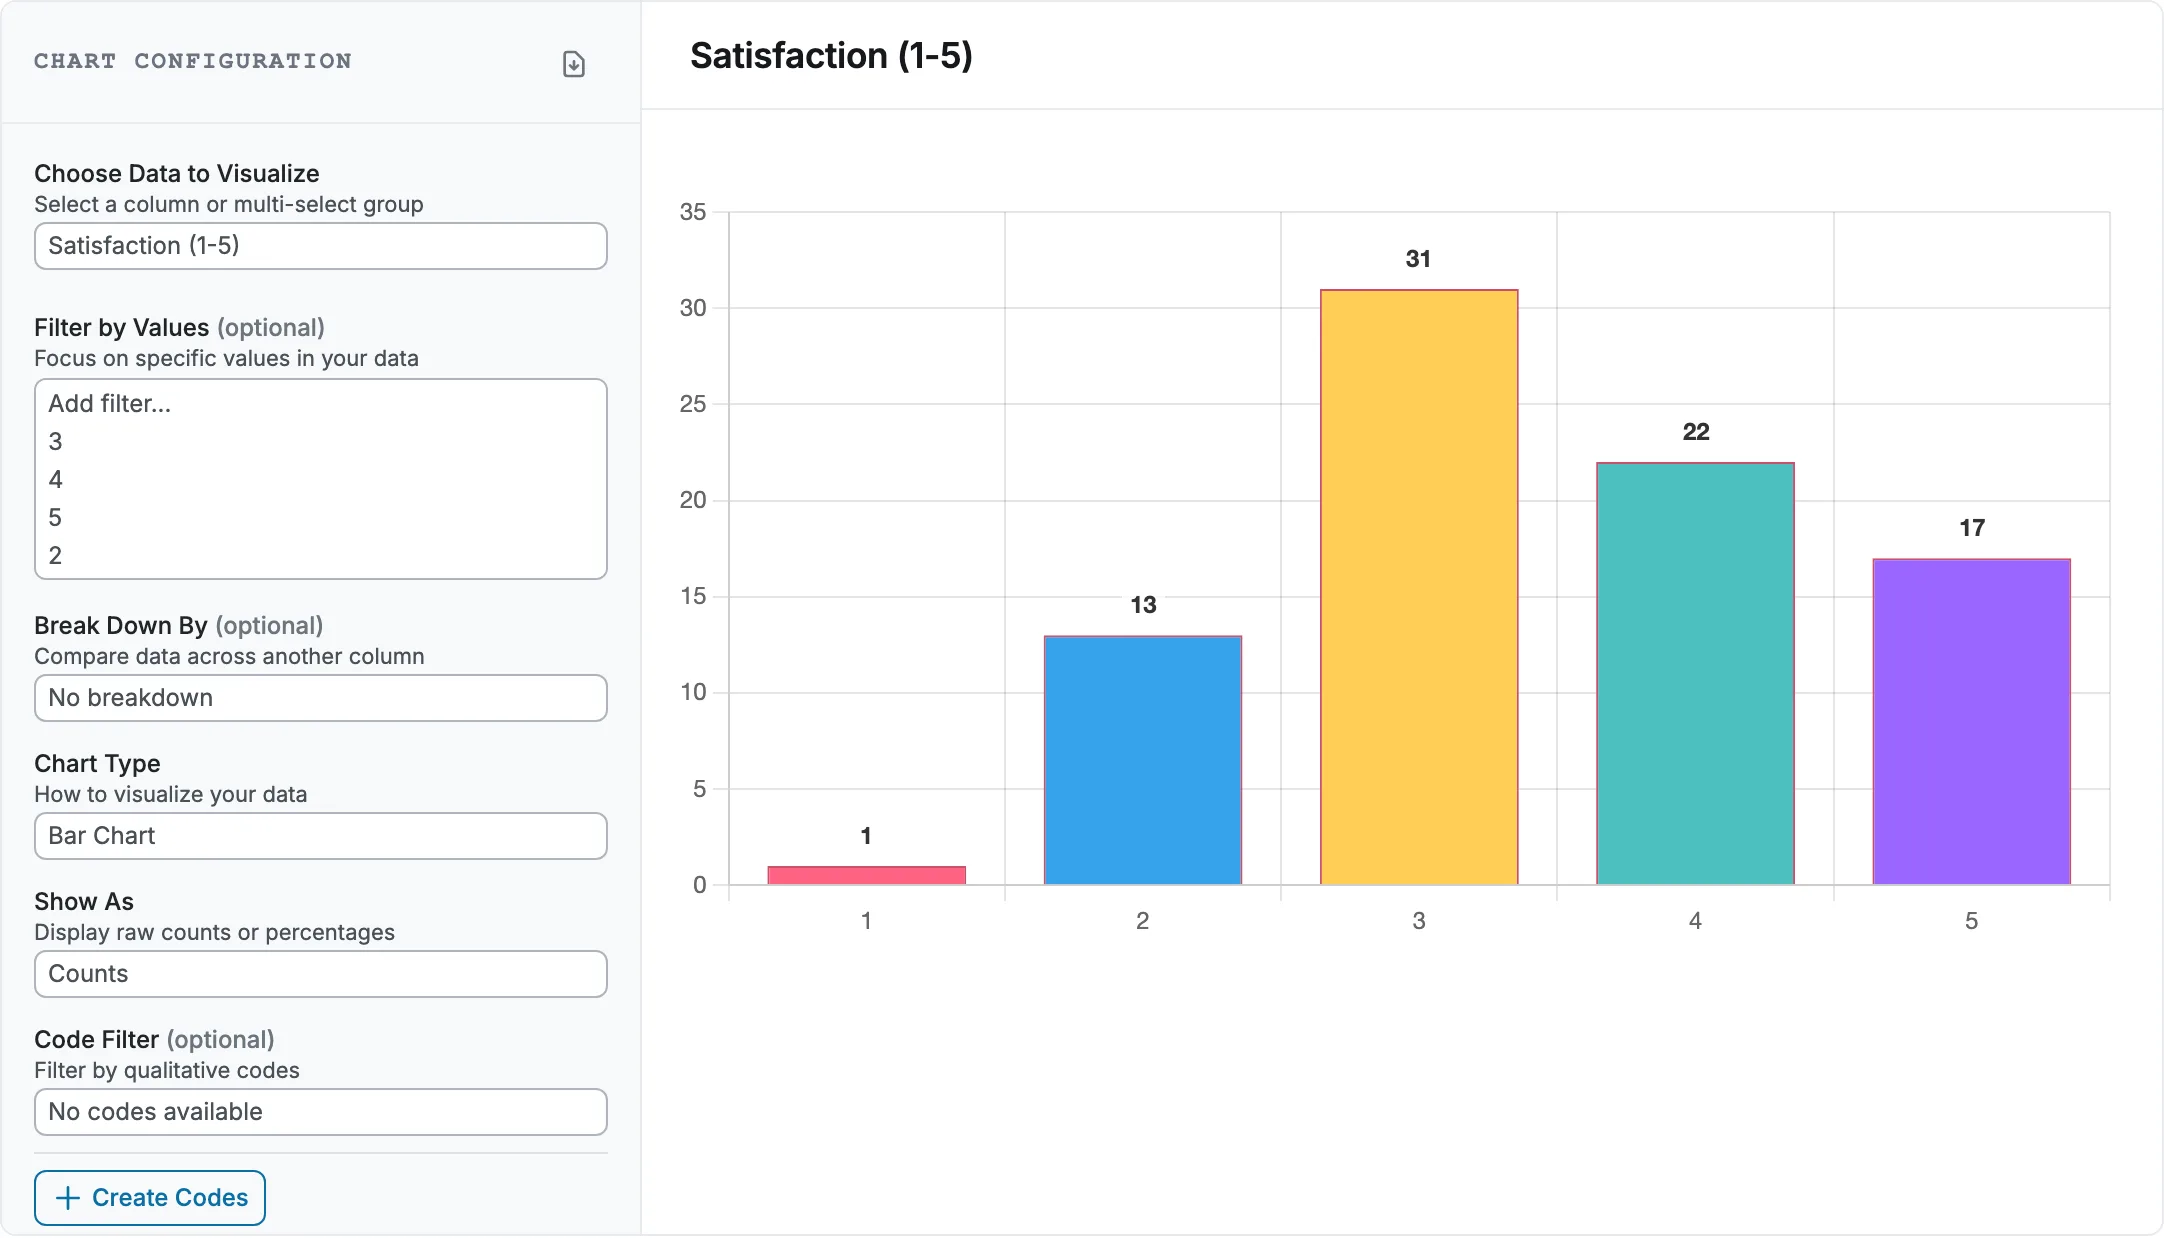
Results come as a chart first and a table second. Bar charts, breakdowns by a second column, and word clouds for free text are built from your column types, so you see the shape of the data before the numbers.

Visualization page showing a bar chart of satisfaction scores from the survey.
04

The statistic, and what it means.

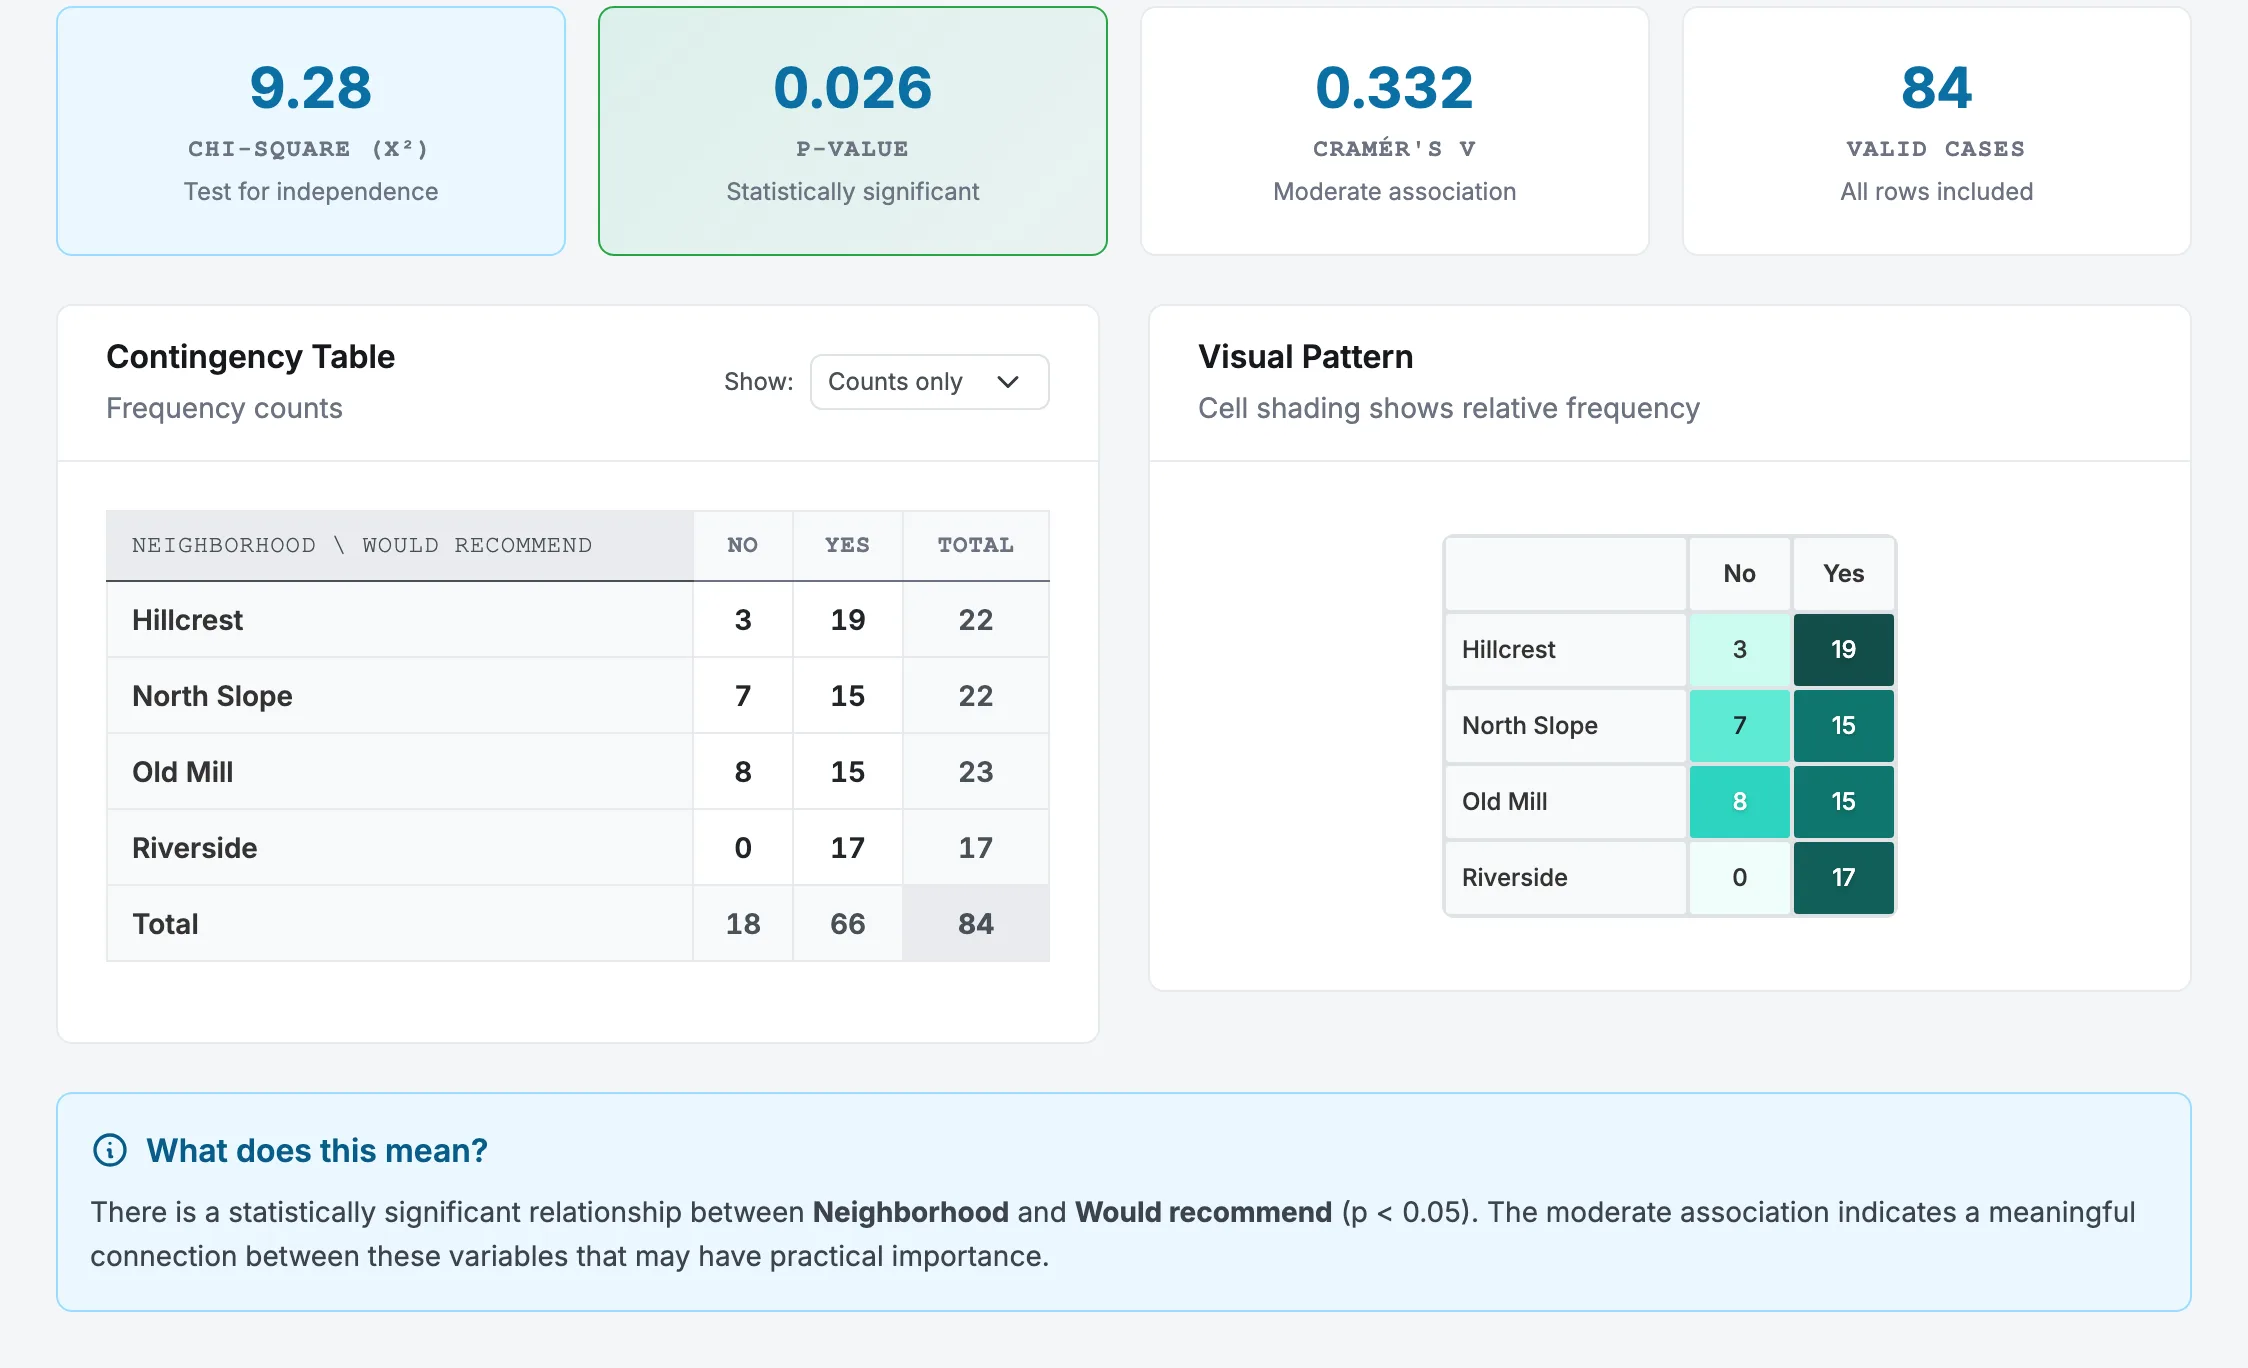
Every result comes with its statistics and a sentence in plain English. A cross-tab reports chi-square, the p-value and Cramér's V, then says whether the association is negligible, weak, moderate or strong. Save it with your own notes and come back to it later.

Cross-tabulation result with chi-square, p-value and effect size tiles above a plain-language summary card.

Analyses

What you can run today

Correlation

Pearson or Spearman correlations across any numeric columns, with p-values and a strength label for every pair.

Cross-tabulation

Contingency tables with chi-square, Cramér's V, and row, column or total percentages.

Logistic regression

Coefficients, odds ratios and a plain-English reading of each predictor's effect on a yes/no outcome.

Cleaning with history

Trim, standardize and remap values with a preview of the change. Every operation creates a version, so undo is one click.

Who it's for

Built for people who think in questions, not syntax.

PhD students

Thesis survey data, a mixed-methods design, and a committee that wants the statistics right. You can run the analysis. You want to be sure you read it correctly.

“If I could change anything, it would be to have someone else do my data analysis.”

Thesis student

Program evaluators

Outcomes data, a reporting deadline, and a funder who asks whether the difference is meaningful. You need the number and the sentence that explains it.

If you are fluent in R or Stata and happy there, Coquali will feel slow. It is built for the researcher who would rather not open them.

Also in the box

  • Qualitative coding Codebooks and code assignments on free-text columns, per rater.
  • Inter-rater reliability Cohen's kappa between two coders.
  • Sharing Invite a collaborator as an editor, with an activity log.
  • History Every version of every file, with one-click restore.

Honest scope

What it doesn't do yet

  • It won't pick the test for you. You choose correlation, cross-tab or regression; it runs and explains the one you chose.
  • No t-tests, ANOVA or non-parametric group comparisons yet. They're next.
  • No real-time collaboration. Sharing works; live co-editing does not.
  • Access is invite-only while in beta.

Questions

What files can I upload?

CSV, Excel (.xlsx or .xls) and JSON, up to 16 MB per file.

Where is my data stored, and who can see it?

Only you and the people you invite to a project can see it. The details are in the privacy policy.

Do I need to know statistics?

You need to know your question. Coquali names the test, reports the standard statistics, and explains the result in a sentence. The page always tells you what you ran, so you can defend the method.

What does it cost?

Nothing during the beta. Pricing comes later, and beta users hear first.

How do I get access?

Fill in the form below. Requests are reviewed by hand and answered within two days.

Beta

Request beta access

Tell us a little about your data and we'll get you in. Beta is invite-only so we can talk to every early user.